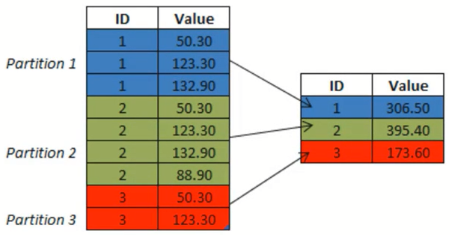
Groupby
The groupby method allows you to group together rows based on a column and perform an aggregate function on them.

Create dataframe
In [2]:
import pandas as pd

data = {'Company':['GOOG','GOOG','MSFT','MSFT','FB','FB'],
       'Person':['Sam','Charlie','Amy','Vanessa','Carl','Sarah'],
       'Sales':[200,120,340,124,243,350]}
In [3]:
df = pd.DataFrame(data)
df
Out[3]:
Now you can use the .groupby() method to group rows together based off of a column name. For instance let's group based off of Company. This will create a DataFrameGroupBy object:
In [4]:
df.groupby('Company')
Out[4]:
You can save this object as a new variable:
In [5]:
by_comp = df.groupby("Company")
And then call aggregate methods off the object:
Get the average sales by each company
- Pandas automatically ignore the non-numeric column "Person"
In [6]:
by_comp.mean()
Out[6]:
In [7]:
df.groupby('Company').mean()
Out[7]:
Using loc() with groupby()
In [8]:
df.groupby('Company').mean().loc['FB']
Out[8]:
More examples of aggregate methods:
In [38]:
by_comp.std()
Out[38]:
Note that "Person" is returned as well. Python is able to sort in descending order
In [39]:
by_comp.min()
Out[39]:
Note that "Person" is returned as well. Python is able to sort in ascending order
In [40]:
by_comp.max()
Out[40]:
Note that Pandas will count "Person" as well
In [41]:
by_comp.count()
Out[41]:
Using describe() with groupby()
The function describe() returns the count, mean, std, min, max and quartile values
In [42]:
by_comp.describe()
Out[42]:
Transpose describe()
In [43]:
by_comp.describe().transpose()
Out[43]:
In [44]:
by_comp.describe().transpose()['GOOG']
Out[44]: