Table of Contents
ETS (Error-Trend-Seasonality) Models will take each of those terms for “smoothing” and may add them, multiply them, or even just leave some of them out.
Based on these key factors, we can try to create a model to fit our data.
Time Series Decomposition with ETS (Error-Trend-Seasonality).
Visualizing the data based on its ETS is a good way to build an understanding of its behaviour.
ETS Decomposition - Airline Passengers

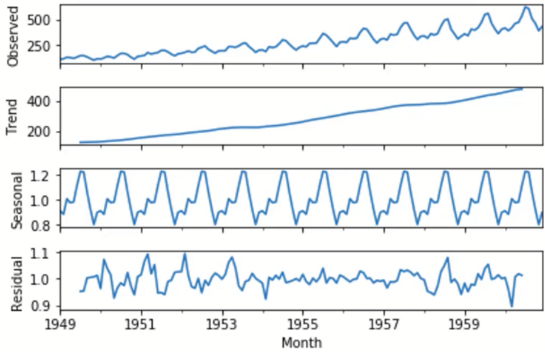
ETS decomposed the observed data into Trend, Seasonal and Residual components
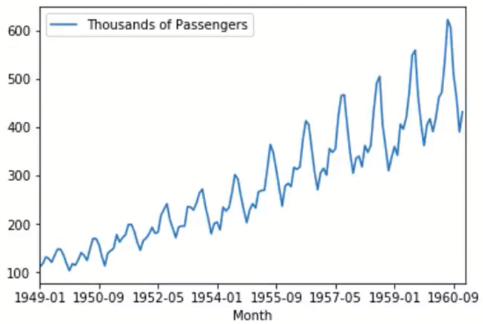
Observed: Actual data points of the time series. This is the exact same plot as the previous plot
Trend: The trend is upward
Sesonal: There is seaonal term and it seems to be really repetitive
Residual: It's a kind of error term that is not explained by the trend and seasonal terms

We will visit Time Series Decomposition again when we discuss ARIMA models.
For now let’s move on to EWMA models!