Financial Market Concepts
We will go over a few key financial topics:
- Types of Funds
- Order Books
- Latency Arbitrage (HFT)
- Short Selling
ETFs
ETFs are exchange traded funds that are constituted of a basket of funds, bonds, commodities etc…
Their holdings are completely public and transparent and individuals can buy and trade the marketable security
Typically people investing in ETFs are more interested in a diversified portfolio and want to keep their investment in an ETF for a longer period of time.
One of the most common ETFs is the Spider (SPY) which tracks the S&P500
Mutual Fund
A mutual fund is an investment vehicle made up of a pool of funds collected from many investors for the purpose of investing in securities such as stocks, bonds, money market instruments and similar assets.
Mutual funds are operated by money managers, who invest the fund's capital and attempt to produce capital gains and income for the fund's investors.
A mutual fund's portfolio is structured and maintained to match the investment objectives stated in its prospectus.
Mutual Funds disclose their holdings typically once a quarter, although this can vary by fund.
Hedge Fund
Hedge funds are alternative investments using pooled funds that employ numerous different strategies to earn active return, or alpha, for their investors.
Hedge funds may be aggressively managed or make use of derivatives and leverage in both domestic and international markets with the goal of generating high returns (either in an absolute sense or over a specified market benchmark).
It is important to note that hedge funds are generally only accessible to accredited investors as they require less SEC regulations than other funds.
One aspect that has set the hedge fund industry apart is the fact that hedge funds face less regulation than mutual funds and other investment vehicles.
Fee Structure
What are the fees associated with each?
- ETF Funds
- Expense Ratio - 0.01% - 1%
- Mutual Funds
- Expense Ratio - 0.5% - 3%
- Hedge Funds
- 2% of Fund. 20% of profits (aka 2 & 20 rule)
Liquidity
What is the liquidity with each?
- ETF Funds
- Buy/Sell just like a stock.
- Mutual Funds
- Buy/Sell at end of day through broker.
- Hedge Funds
- Depends on agreement
Order Books
Making an Order includes the following:
- Buy or Sell
- Symbol
- Number of Shares
- LIMIT or MARKET
- Price (only needed for a LIMIT order)
Example orders:
- BUY, AAPL, 200, MARKET
- SELL, TSLA, 400, MARKET
- BUY, AMD, 2000, LIMIT, 13.95
- SELL, NVDA, 150, LIMIT, 160.99
Once you’ve sent an order (usually to your broker), it goes to an exchange (for a larger order it can go to multiple exchanges, but more on that later)
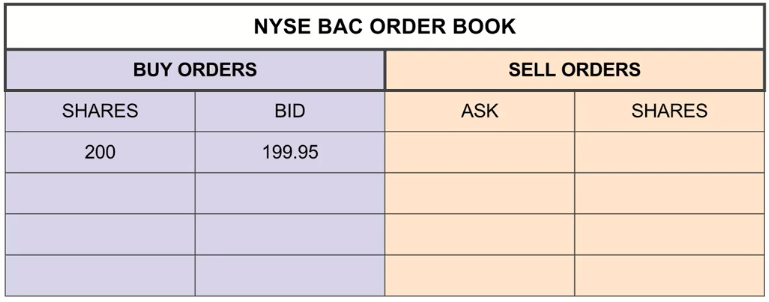
Once an exchange receives your order, it goes into an order book.
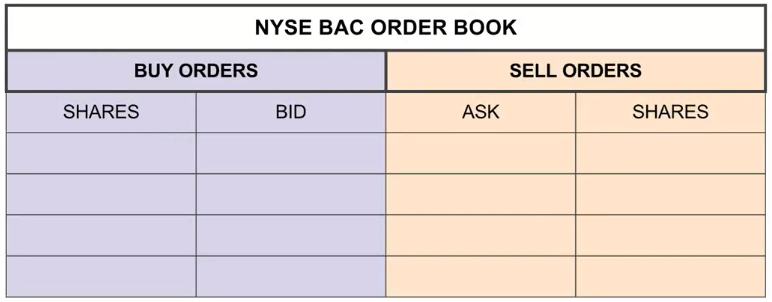
BUY, BAC, 200, LIMIT, 199.95
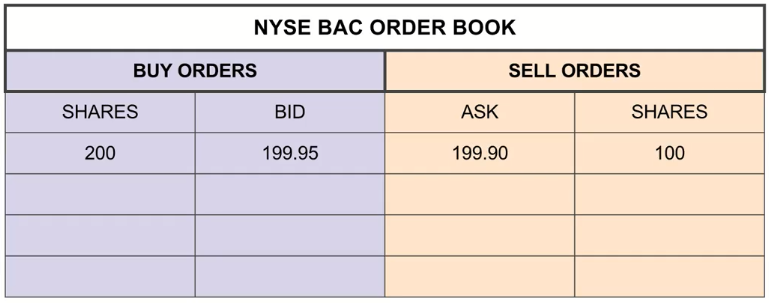
SELL, BAC, 100, LIMIT, 199.90
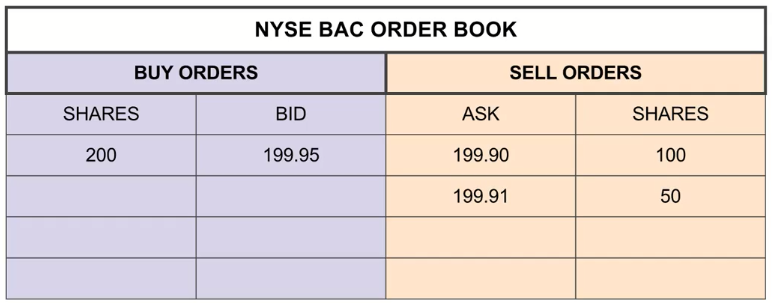
SELL, BAC, 50, LIMIT, 199.91
SELL, BAC, 50, LIMIT, 199.92
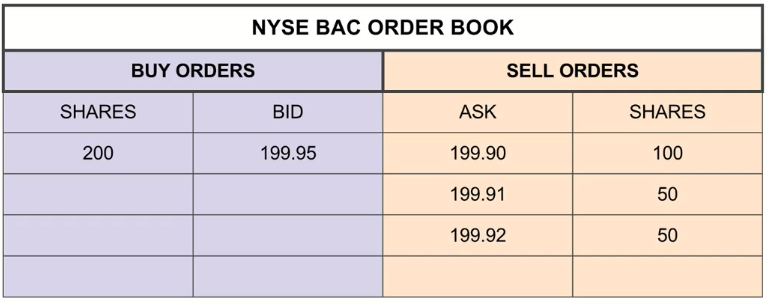
Example of an order book:
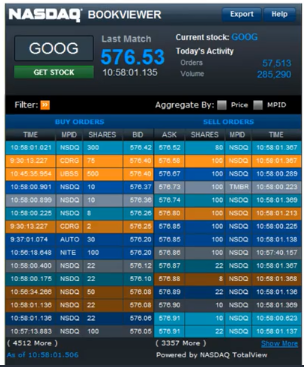
So how does an order actually get to the exchange?
Let’s walk through the steps, we’ll also explain how certain HFT (High Frequency Trading) firms can attempt Latency Arbitrage!
Scenario #1 : Simple Buy
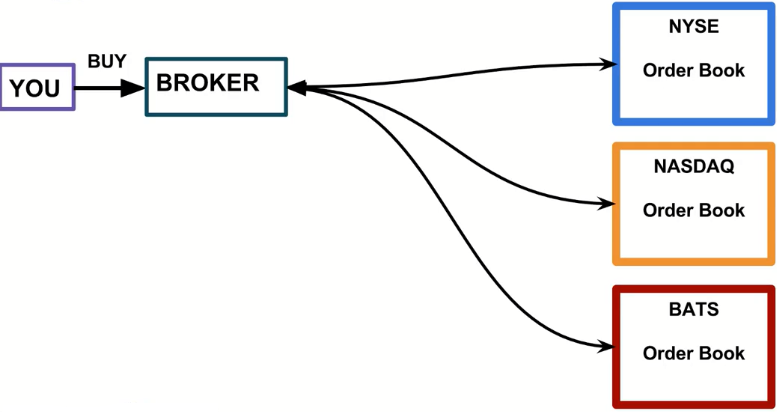
Scenario #2 : Broker Buy/Sell
- This can all happen within the broker, without ever reaching the exchange.
- By law the broker must provide the same price you could have gotten on the exchange.

Scenario #3 : Dark Pool
- Not accessable to the public
- Around since 80s
- In 2014, about 40% of all U.S. stock trades didn't actually ever reached the exchange. About 15% of those trades actually occurred in a dark pool

Scenario #4 : HFT
High Frequency Trading (HFT) firms take advantage of latency differences due to geographical distances.
These times are on the order of microseconds.
Discussion about HFTs were popularized by Michael Lewis’ book “Flash Boys”, about Brad Katsuyama and the IEX.
Let’s briefly explain the basic idea of HFT, but keep in mind this is an area that changes extremely fast due to technology!

It takes about 2 ms between the order first reaching BATS (closest) to the last exchange NYSE (furthest away). FYI, it takes 300ms to blink an eye.

This was a simplified overview, check out the following resource links if this is a topic that interests you.
HFT in general is not really relevant for our scale or approach to trading.
Short Selling
Short-selling allows you to profit if a stock drops in price, however it comes with a great risk, due to the fact that there can be no ceiling to the amount of money you could possibly lose!


You should note, that if the price goes up instead of down, you will lose money buying back the stock to give it back to RED!
Also all these transactions would happen through a broker, not directly.
CAPM
The Capital Assets Pricing Model (CAPM) is one of the most fundamental topics in investing!
It is a model that helps describe risk and separating market return versus your portfolio return.
Remember that a portfolio is a set of weighted securities. We can define the returns as the following:
$$r_p(t) = \sum_{i}^{n} w_i r_i(t)$$
We can also imagine the entire market as a portfolio, for example the S&P500
How do we get weights for each company? Using the market cap (# shares * price)
$$w_i = \frac{MarketCap_i}{\sum{j}^{n} MarketCap_j}$$
The CAPM Equation
The CAPM equation describes the return of some individual stock i:
$$r_i(t) = \beta_ir_m(t) + \alpha_i(t)$$
There are two terms here, the Beta term $\beta$ and the Alpha term $\alpha$.
Note how this models resembles a simple regression line: y = mx +b
Beta $\beta$
The Beta term $\beta$ implies that the return of a stock is equivalent to the return of the market multiplied by this Beta factor plus some residual alpha term.
You could imagine that if Beta=1, then this stock moves in line with the market. If Beta=2 , then this stock moves up and down twice as much as the general market.
Alpha $\alpha$
Since the return for a stock “i” is not going to match exactly with the Beta term, we add some alpha term.
With CAPM stating that alpha should be expected to be zero, it basically implies that you can not beat the general market!
CAPM also says that alpha is random and can not be predicted!
Passive vs Active Investment
This basically creates the argument of passive versus active investment.
Active investors (like us) believe we can predict alpha to some degree.
Remember that we don’t need to be 100% correct on alpha, we should just be able to predict it correctly more than 50% of the time for our portfolio.
Since we believe we can have a good idea for values of alpha, we can break it up per security:
$$r_p(t) = \beta_pr_m(t) + \sum_{i}^{n} w_i \alpha_i(t)$$
We could even continue to break up Beta into various Betas per sector of the market (Energy, Manufacturing, Tech, Finance, etc)
The main point here we want to get across is that there will be some relationship between our portfolio return and the overall market return.
This is the Beta term.
CAPM says that the alpha term can not be predicted, however, we will fundamentally disagree with that model of thinking.
We will see if we can create strategies that allow us to have significant alpha terms, meaning our strategy beats the market.
Stock Splits and Dividends
Stock Splits
Stock splits usually occur if the price for an individual stock becomes unreasonably high, so companies essentially just create a ratio split (e.g. 2:1 , 3:1 , 4:1).
Because stock splits could cause errors for algorithms looking for price changes, we use the Adj. Close , which adjusts the historical prices to match up and take into account the stock splits.
Dividends
Often stocks also pay dividends, for each unit of stock, each shareholder receives some payout.
This causes the price to jump before the dividend announcement, and then drop after the dividend is paid out.
The adjusted close price also takes this into account.
It is important to always use adjusted close prices, otherwise you may be affected by stock splits and dividends in your pricing strategies.
Survivorship Bias
If we take a look at the S&P500 benchmark today, it is a different set of companies than say in the year 1999 (the peak of the dot-com bubble).
After the dot-com crash many companies that were in the S&P500 no longer existed or became too small to be part of the 500. This means the time you pick S&P500 could possibly matter!
If we were creating strategies in the early 2000s, we may have heavily used the S&P500, but if we didn’t take into account the earlier make-up of the S&P500 we would end up having a bias in our results due to that dot-com crash!
Keep Survivorship Bias in mind in case you end up using a benchmark as part of your strategy and you backtest to 2007 (financial crisis).
You can buy Survivor Bias Free data from a variety of sources (including Quandl), keep in mind it is usually not free (although it isn’t very expensive either, check Quandl premium or other sources for the latest pricing).
Efficient Market Hypothesis
Efficient Market Hypothesis (EMH) is an investment theory that states it is impossible to "beat the market" because stock market efficiency causes existing share prices to always incorporate and reflect all relevant information.
According to the EMH, stocks always trade at their fair value on stock exchanges, making it impossible for investors to either purchase undervalued stocks or sell stocks for inflated prices.
As such, it should be impossible to outperform the overall market through expert stock selection or market timing, and the only way an investor can possibly obtain higher returns is by purchasing riskier investments.
So is EMH true?
If the EMH is true, then a lot of what we will learn in this course doesn’t have a point to it.
It would also imply that many hedge funds are just extremely lucky.
The success of different strategies and hedge funds implies the the strongest interpretation of EMH is probably not true.
There are also events that have shown the market to be overvalued at certain points in history (financial crisis, dot com bubble, etc)
While some aspects of EMH certainly are true, especially as information is more widely acceptable, we will continue on with the assumption that the market is not 100% efficient!